Where did that number come from?
In a spreadsheet: typed in by hand.
In Cybermain: trace it to the source, query and collection time. Open the figure and follow the evidence.
Cyber posture your board can read.
Evidence your auditor can check.
Connect the tools you already own. Understand your exposure. Make the next decision with confidence.
Explore the product ↘From the boardroom question to the evidence behind it. Follow the thread.
See what makes it credible ↗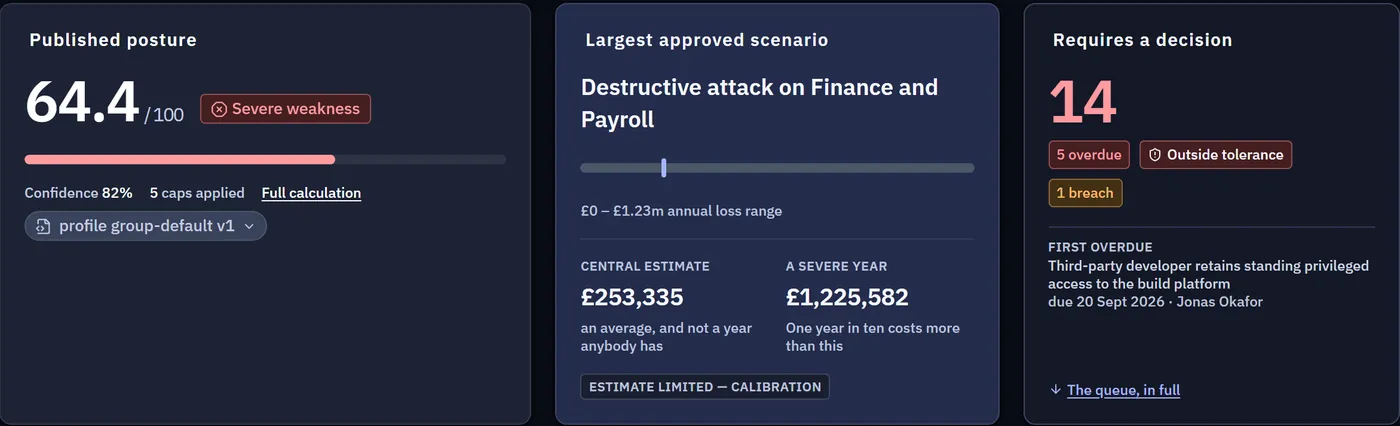
Keep the investments you’ve made.
Bring their evidence into one conversation.
Run against a live customer tenant.
Built and tested on synthetic data. The first customers to connect them validate them with us.
The context behind the colour.
The evidence behind the decision.
In a spreadsheet: typed in by hand.
In Cybermain: trace it to the source, query and collection time. Open the figure and follow the evidence.
In a spreadsheet: a green cell can outlive its evidence.
In Cybermain: a gap is grey, with a reason. Missing evidence lowers the confidence shown beside the score.
In a spreadsheet: an amber rating.
In Cybermain: named scenarios, a loss range and your stated appetite. Assumptions stay visible.
A connected view of your cyber posture,
from the headline to the next action.
Posture, confidence and the decisions waiting for you. A shared starting point for leadership and security.
Posture with contextThe score is accompanied by its confidence and any binding caps.
Exposure in business termsThe largest approved scenario carries a range and stated limitations.
A clear next stepDecisions are surfaced with their owner and urgency.
Seven more views, each connected to the evidence behind your posture.
All product screens show Northwind, a synthetic demonstration organisation. No customer data is pictured.
Useful answers begin with being clear
about what you know — and what you don’t.
Trace a score to its source, query, collection time and formula. Source reliability is recorded too. If a number cannot be traced, it is not shown as a score.
Missing or stale evidence appears as unknown, with a reason. Contradictory data is explicit too. Confidence is shown separately, so a reassuring score cannot hide weak evidence.
Manual controls have named owners, evidence references and a review trail. They expire and require second-line sign-off. An attested control tops out below a measured one: a supported claim still carries less weight than a measurement.
Named scenarios. FAIR-based loss modelling.
Your appetite, alongside the uncertainty.
A range around a central estimate, because the inputs carry uncertainty.
Two different views of the same scenario. The severe year is shown alongside the central estimate.
This scenario’s severe year exceeds the stated appetite. A decision is due within 30 days.
Estimate limited: calibration. Every figure states what limits it. When inputs are too weak to price, the scenario says so.
A register brings together annual loss range, likelihood, severe-year exposure and the verdict against appetite. Scenarios are not added into a single total.
Each scenario says what happens, who would do it, which service it affects and who owns it, before showing a single pound.
Backup and recovery · Privileged access · Network segmentation · Server EDR coverage. Follow each driver through to its score and evidence.
Start with the services you depend on. Adopt relevant scenarios, record the owner’s assessment and take each one to a decision.
Built for the questions that come
after the headline number.
Exposure, control effectiveness, governance health and evidence confidence roll up from the same domain scores as overall posture. Governance and technical exposure remain visible side by side.
A weighted geometric mean of completeness, freshness and source reliability. A zero in any component pulls confidence down instead of being averaged away.
KEV listing and EPSS determine which findings inherit the seven-day SLA. Severity, exploitability, asset criticality and age inform vulnerability posture.
Inspect connector health, collection time, duration, record count, failures and run history. The reconciliation queue sits beside the sources it depends on.
Recomputations append a new row linked to the one they replace, with a reason. Formula and profile versions stay pinned so earlier scores remain explainable.
Signed attestations every 90 days and unsigned operational reviews every 30 keep emerging drift visible while signatures retain their meaning.
These controls are built into the product. Our residual-risk register records what is not yet mitigated, and why.
Ask for the detail ↗Database triggers refuse updates and deletes. Auditors can verify the chain.
A separate key for each connector credential. Secrets are never returned by an endpoint, and every read is audited.
OpenID Connect sign-in, ready for Entra ID and configured per organisation, with multi-factor authentication.
Attestation submitters cannot approve their own submission. Risk acceptances require a justification, approver and expiry.
Thirty minutes. A demonstration estate. A conversation about yours.